An amazing 9 minute video about train graphs
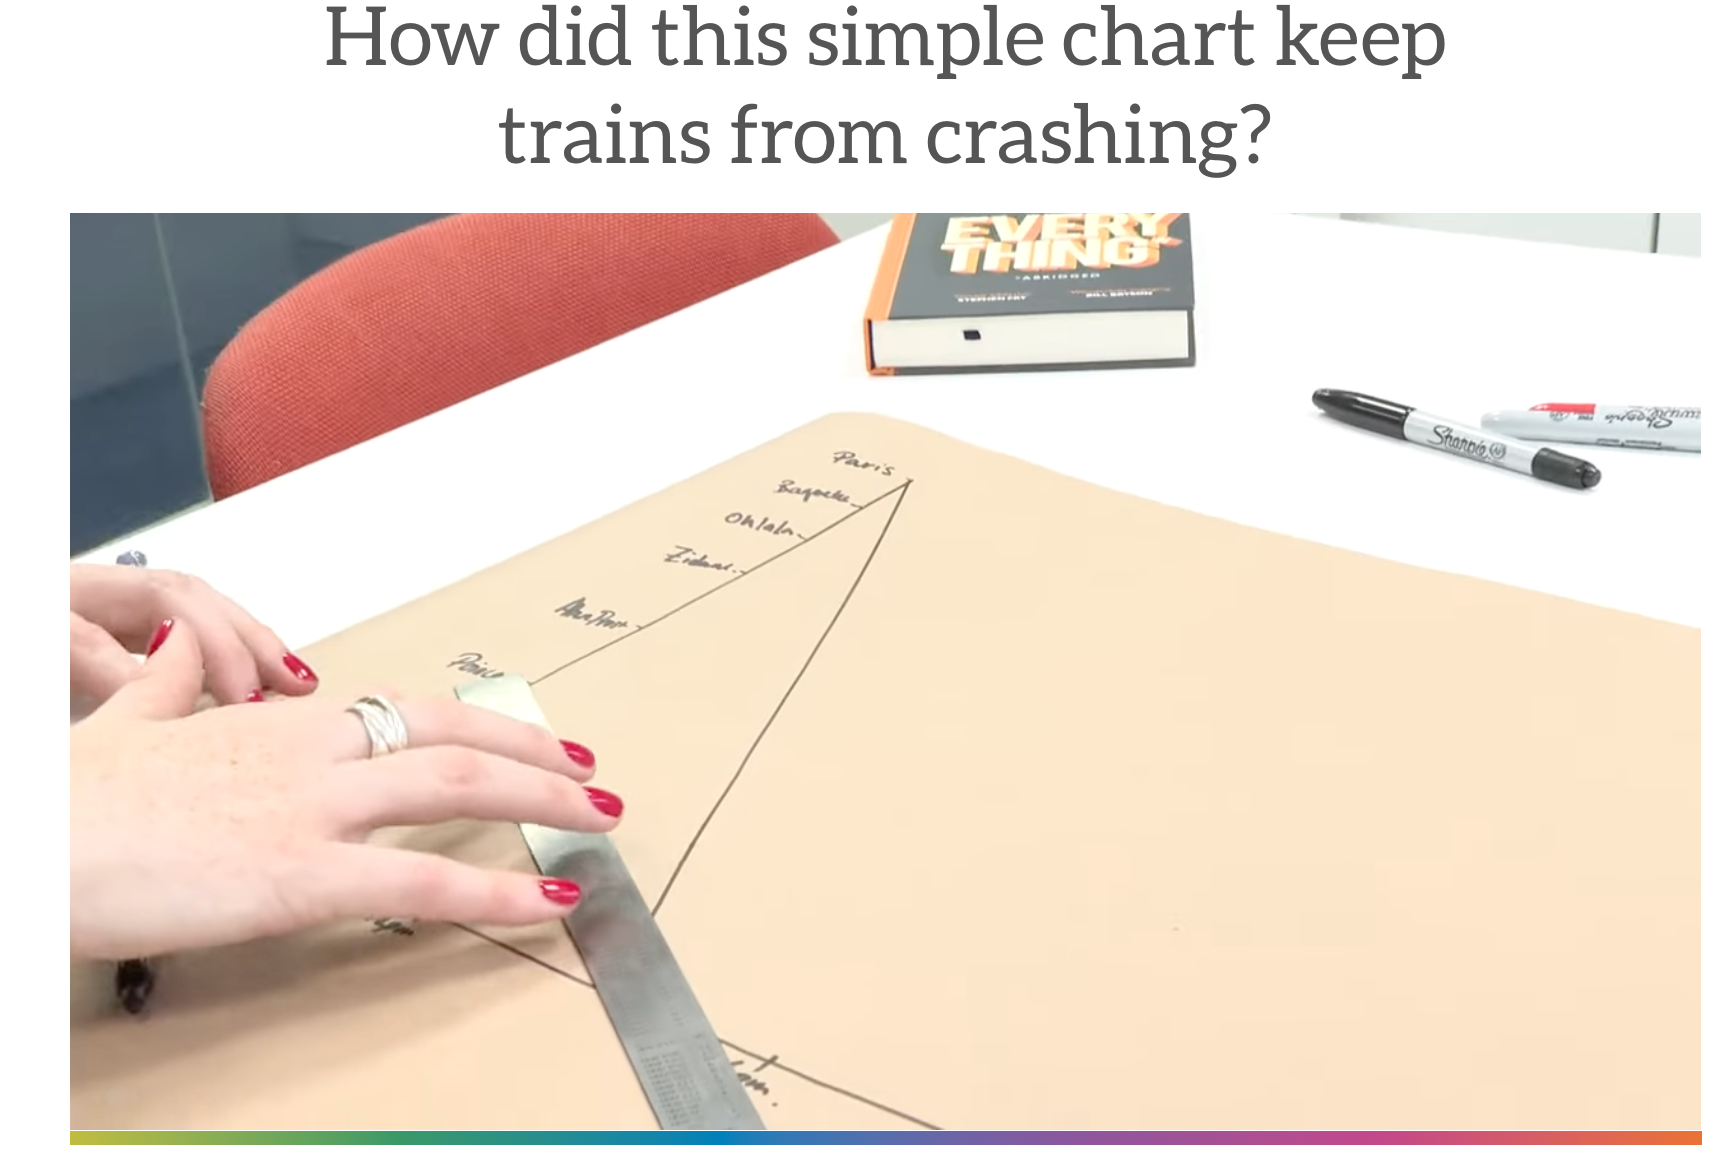
— a ruler, paper and a pencil could prevent train crashes. How did this simple chart keep trains from crashing?:
Ibry displayed a chart that could show simultaneously the locations of all the trains between Paris and Le Havre in a twenty-four-hour period … the horizontal axis denoted the passing of time … down the vertical axis, each station was marked out along the route to Le Havre.