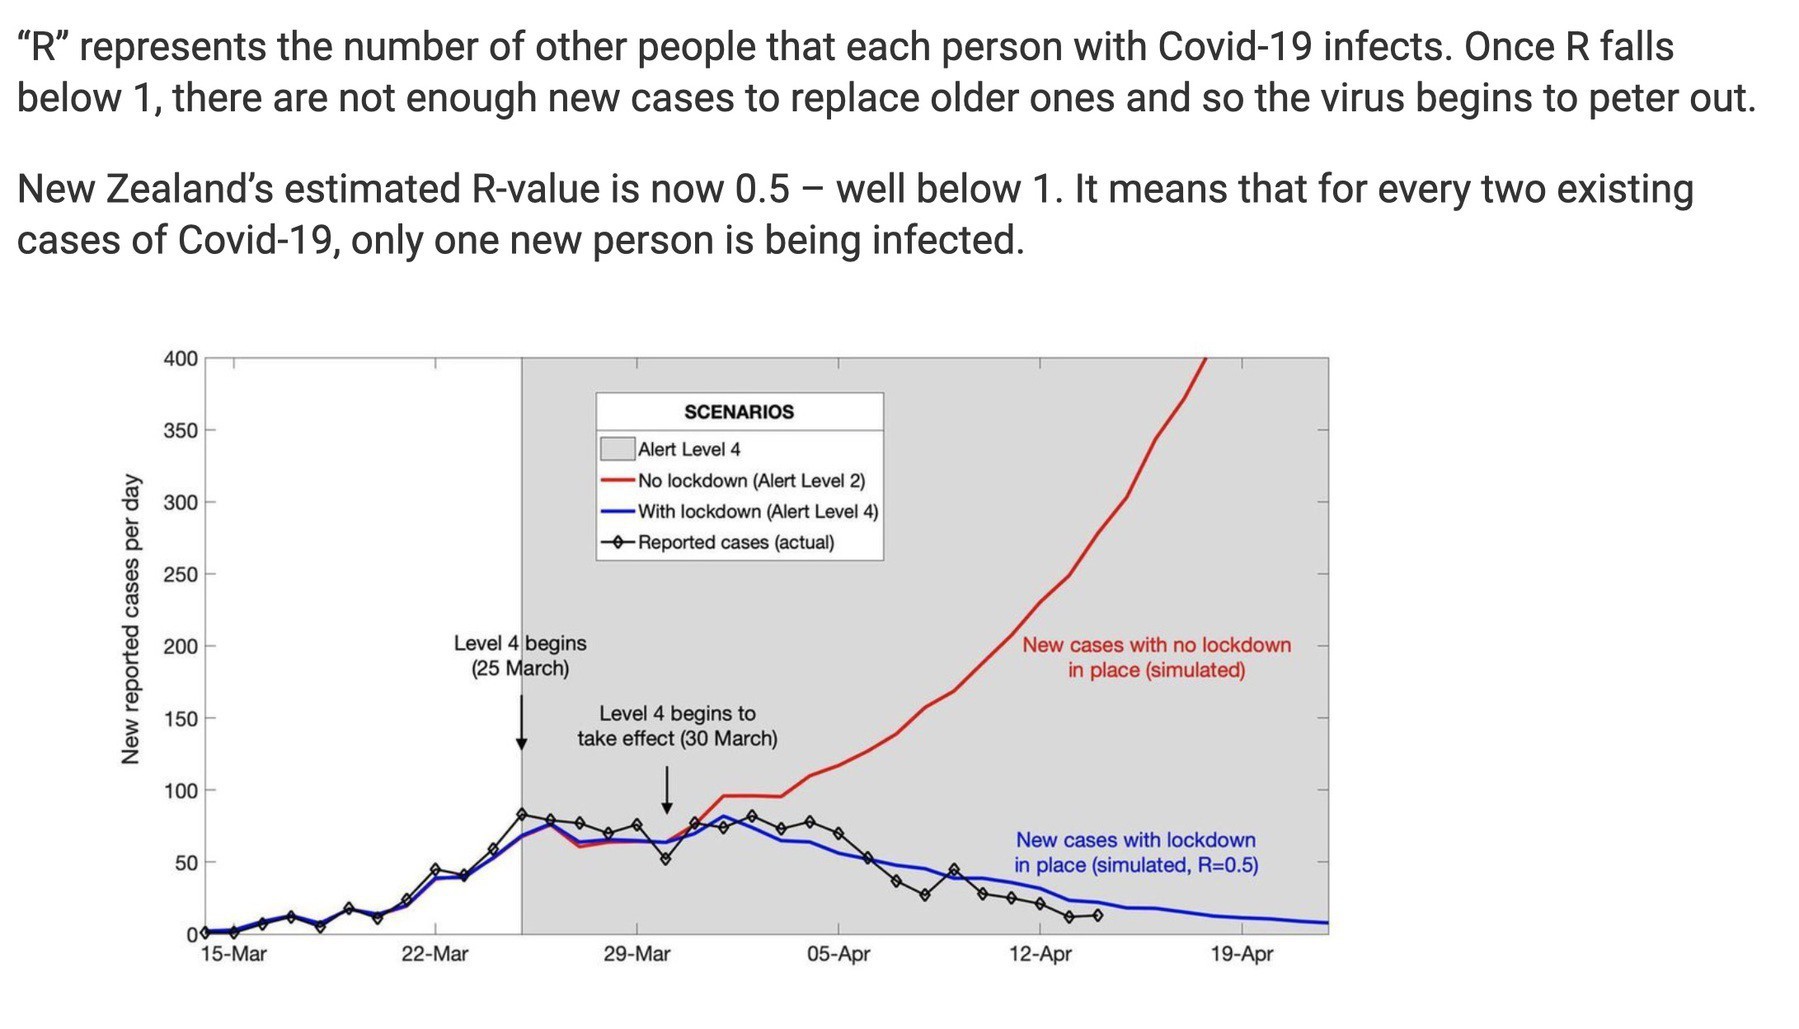
👍 decisive action. On the chart the red line is the model for how many Covid-19 cases Aotearoa New Zealand could have had. The black line is the actual cases we do have, thanks to a stringent shutdown instituted almost 4 weeks ago. Thank you Government who acted on science.